


The median sterile processing technician salary in the US was $47,700 a year, or $22.93 an hour, in May 2025, according to the Bureau of Labor Statistics (BLS). BLS calls the job "medical equipment preparers." The lowest-paid 10% earned under $36,410 and the highest-paid 10% earned over $69,950 (BLS OEWS, May 2025).
BLS does not publish a separate figure for CRCST holders.
The national numbers
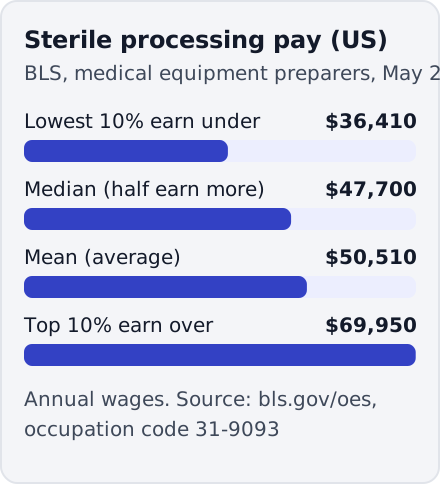
| Measure (May 2025) | Hourly | Annual |
|---|---|---|
| 10th percentile | $17.50 | $36,410 |
| 25th percentile | $19.13 | $39,800 |
| Median | $22.93 | $47,700 |
| Mean | $24.28 | $50,510 |
| 90th percentile | $33.63 | $69,950 |
| Number employed | 77,420 |
Source: BLS Occupational Employment and Wage Statistics, occupation code 31-9093. BLS updates these figures each year; newer data appears on the OEWS page.
The median is the middle worker: half earned more, half earned less. The mean is the average, and a few high earners pull it up. Compare a job offer with the median.
BLS doesn't publish an entry-level wage, but the lower percentiles are a fair guide for a first job: a quarter of medical equipment preparers earned under $19.13 an hour ($39,800 a year), and a tenth earned under $17.50 ($36,410).
In the same data, 53,280 of the 77,420, about 7 in 10, worked in general medical and surgical hospitals. Many hospital job posts ask for a certification such as the CRCST. If you're working toward it, the free 25-question CRCST diagnostic shows which exam domains you'd need to study before you apply.
Where pay is highest
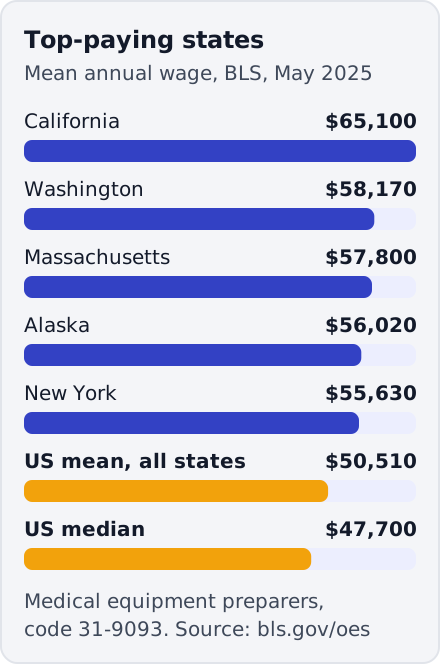
The ten highest-paying states for medical equipment preparers, by mean wage:
| State | Mean hourly wage | Mean annual wage | Employed |
|---|---|---|---|
| California | $31.30 | $65,100 | 8,720 |
| Washington | $27.97 | $58,170 | 1,670 |
| Massachusetts | $27.79 | $57,800 | 1,900 |
| Alaska | $26.93 | $56,020 | 220 |
| New York | $26.75 | $55,630 | 5,190 |
| District of Columbia | $26.35 | $54,800 | 310 |
| Delaware | $26.07 | $54,220 | 190 |
| New Jersey | $26.03 | $54,150 | 2,440 |
| Vermont | $25.73 | $53,530 | 140 |
| Rhode Island | $25.66 | $53,380 | 190 |
California pays about 29% more than the national mean of $50,510. Three of the ten, New York, Delaware and New Jersey, also require certification by law.
Show pay in every state
| State | Employed | Median hourly | Median annual | Mean annual |
|---|---|---|---|---|
| Alabama | 1,000 | $17.21 | $35,800 | $36,820 |
| Alaska | 220 | $24.00 | $49,920 | $56,020 |
| Arizona | 2,320 | $22.50 | $46,790 | $47,010 |
| Arkansas | 320 | $18.32 | $38,100 | $41,080 |
| California | 8,720 | $29.50 | $61,370 | $65,100 |
| Colorado | 1,950 | $22.93 | $47,700 | $49,190 |
| Connecticut | 1,060 | $23.07 | $47,980 | $50,220 |
| Delaware | 190 | $25.63 | $53,300 | $54,220 |
| District of Columbia | 310 | $23.40 | $48,670 | $54,800 |
| Florida | 5,250 | $22.06 | $45,890 | $46,940 |
| Georgia | 1,860 | $23.00 | $47,850 | $49,470 |
| Hawaii | 220 | $24.82 | $51,630 | $52,750 |
| Idaho | 580 | $22.33 | $46,450 | $47,930 |
| Illinois | 2,800 | $23.10 | $48,050 | $50,940 |
| Indiana | 1,750 | $21.74 | $45,210 | $45,630 |
| Iowa | 590 | $19.20 | $39,930 | $43,710 |
| Kansas | 740 | $21.77 | $45,280 | $45,920 |
| Kentucky | 1,120 | $22.54 | $46,880 | $47,390 |
| Louisiana | 620 | $17.29 | $35,960 | $37,710 |
| Maine | 510 | $22.53 | $46,860 | $47,140 |
| Maryland | 1,160 | $23.40 | $48,680 | $49,960 |
| Massachusetts | 1,900 | $28.16 | $58,580 | $57,800 |
| Michigan | 2,420 | $21.96 | $45,670 | $46,540 |
| Minnesota | 1,390 | $24.07 | $50,070 | $51,900 |
| Mississippi | 350 | $16.90 | $35,160 | $37,350 |
| Missouri | 1,970 | $20.91 | $43,480 | $44,220 |
| Montana | 330 | $21.47 | $44,670 | $45,120 |
| Nebraska | 550 | $19.94 | $41,480 | $44,390 |
| Nevada | 510 | $22.43 | $46,640 | $48,640 |
| New Hampshire | 380 | $23.51 | $48,900 | $51,550 |
| New Jersey | 2,440 | $24.18 | $50,280 | $54,150 |
| New Mexico | 300 | $17.66 | $36,720 | $40,970 |
| New York | 5,190 | $27.56 | $57,320 | $55,630 |
| North Carolina | 2,900 | $21.70 | $45,130 | $46,220 |
| North Dakota | 350 | $18.71 | $38,910 | $48,660 |
| Ohio | 3,210 | $21.90 | $45,540 | $45,360 |
| Oklahoma | 690 | $20.89 | $43,460 | $43,820 |
| Oregon | 1,570 | $23.51 | $48,890 | $50,790 |
| Pennsylvania | 3,450 | $22.03 | $45,820 | $46,260 |
| Puerto Rico | 140 | $13.61 | $28,310 | $30,820 |
| Rhode Island | 190 | $24.74 | $51,460 | $53,380 |
| South Carolina | 1,160 | $20.44 | $42,510 | $43,960 |
| South Dakota | 480 | $20.35 | $42,330 | $42,990 |
| Tennessee | 1,590 | $22.59 | $46,990 | $47,420 |
| Texas | 4,520 | $22.58 | $46,970 | $49,380 |
| Utah | 600 | $23.07 | $47,980 | $50,270 |
| Vermont | 140 | $23.56 | $48,990 | $53,530 |
| Virginia | 1,840 | $22.40 | $46,580 | $47,510 |
| Washington | 1,670 | $28.28 | $58,830 | $58,170 |
| West Virginia | 530 | $21.55 | $44,830 | $43,070 |
| Wisconsin | 1,380 | $22.87 | $47,570 | $48,220 |
| Wyoming | 120 | $23.18 | $48,210 | $48,780 |
BLS OEWS, May 2025, occupation code 31-9093, all 50 states plus the District of Columbia and Puerto Rico. Sorted by name.
The ten highest-paying metro areas are all in California except Seattle:
| Metro area | Mean hourly wage | Mean annual wage | Employed |
|---|---|---|---|
| San Jose-Sunnyvale-Santa Clara, CA | $40.77 | $84,800 | 540 |
| San Francisco-Oakland-Fremont, CA | $37.23 | $77,440 | 1,070 |
| Vallejo, CA | $36.90 | $76,760 | 140 |
| Sacramento-Roseville-Folsom, CA | $35.91 | $74,690 | 680 |
| Santa Cruz-Watsonville, CA | $34.00 | $70,730 | 50 |
| San Luis Obispo-Paso Robles, CA | $33.83 | $70,360 | 60 |
| San Diego-Chula Vista-Carlsbad, CA | $32.30 | $67,180 | 630 |
| Stockton-Lodi, CA | $31.49 | $65,500 | 100 |
| Santa Rosa-Petaluma, CA | $31.32 | $65,140 | 150 |
| Seattle-Tacoma-Bellevue, WA | $30.61 | $63,660 | 910 |
Source for both tables: BLS OEWS state and metro estimates, May 2025, occupation code 31-9093, checked November 4, 2026. Some metros employ only a few dozen techs, so check the employment column before reading much into one figure.
The highest-paying industries in the same data were medical equipment and supplies manufacturing ($69,590 mean) and management, scientific and technical consulting services ($67,020 mean). High-wage states also tend to have high rent, so compare pay with living costs where you plan to work.
Job outlook
BLS projects that employment of medical equipment preparers will grow from about 79,900 jobs in 2025 to 88,600 in 2035, a rise of 10.8%. It projects 3.5% growth for all occupations over the same years. BLS also expects about 10,700 openings a year on average, including jobs left open by workers who move to other occupations or leave the labor force (BLS employment projections, 2025 to 2035).
The projections use a different BLS count than the wage survey, so their 2025 figure doesn't match the 77,420 above.
How to compare a job offer with BLS data
BLS turns hourly wages into annual ones by multiplying by 2,080 hours, a 40-hour week for 52 weeks (BLS technical notes). You can do the same with any offer:
| Step | Example |
|---|---|
| 1. Take the hourly rate | An offer of $20.00 an hour |
| 2. Multiply by 2,080 | $41,600 a year |
| 3. Compare with the national median | $6,100 below $47,700 |
| 4. Compare with your state or metro median | Look it up on the OEWS page under code 31-9093 |
Step 4 matters most. A national median mixes high-cost and low-cost areas. The state or metro figure comes from the same survey and fits your market.
Then ask the employer about pay that isn't in the base rate:
- Shift differentials for evenings, nights and weekends
- On-call pay, common in departments that support 24-hour operating rooms
- Overtime rules
- Tuition or exam fee support for the CRCST and later certifications
What the BLS category includes
"Medical equipment preparers" covers people who prepare, sterilize, install or clean lab and healthcare equipment. That includes sterile processing and central service techs, plus some roles outside a hospital department. Certified and uncertified workers are counted together.
The BLS numbers don't show:
- how much more a certified tech earns than an uncertified one
- the gap between a new tech and one with ten years in the job
- pay for lead tech, educator or supervisor roles, which BLS often counts elsewhere
We found no official source that measures a pay difference for the CRCST. Salary sites publish estimates with unclear methods and sample sizes, so we don't repeat them.
How certification connects to pay
Certification decides which jobs you can apply for, even where it doesn't set the rate.
- Hiring. Many hospital job posts require or prefer a technician certification such as the CRCST or CBSPD's CSPDT. Some hire uncertified techs and set a deadline to certify.
- State law. HSPA lists seven states that require certification to work in sterile processing: Connecticut, Delaware, Minnesota, New Jersey, New York, Pennsylvania and Tennessee (HSPA legislative page). New York, the fifth-highest-paying state, is one of them. New hires there have 18 months to certify. Our certification page lists the deadline in each state.
- Moving up. Lead tech, educator and supervisor roles usually expect experience plus certification. HSPA's further credentials, such as the CIS and CHL, need a current CRCST (HSPA certification overview).
- Cost. The CRCST exam fee is $140. At the median wage of $22.93 an hour, that is about six hours of work.
To see what certification is worth where you live, search your city for "sterile processing technician." Note the pay range on posts that require certification and on posts that don't.
Getting certified
The CRCST exam has 150 questions and covers seven domains. The free 25-question CRCST diagnostic shows your score in each one, so you know how far you are from test-ready. These pages cover the rest:
- How to become a sterile processing technician
- Sterile processing technician certification: state laws and which credential
- CRCST 400 hours: the hands-on requirement
- The CRCST exam: format, cost and scheduling
Frequently asked questions
What is the average sterile processing technician salary?
The median sterile processing technician salary was $47,700 a year in BLS's May 2025 data for medical equipment preparers, and the mean was $50,510. The median is the better guide, because a few high earners pull the mean up.
How much does a CRCST make?
BLS does not report pay for CRCST holders separately. For medical equipment preparers, the federal category that includes sterile processing techs, the May 2025 median was $47,700 a year. Eight in ten earned between $36,410 (the 10th percentile) and $69,950 (the 90th).
How much do entry-level sterile processing techs make?
BLS doesn't publish an entry-level figure, but the 25th percentile for medical equipment preparers was $19.13 an hour ($39,800 a year) in May 2025, and the 10th percentile was $17.50 ($36,410). Where a first offer lands depends on the area, the employer and the shift.
What is the hourly pay for a sterile processing technician?
The median was $22.93 an hour in BLS's May 2025 data for medical equipment preparers, and the mean was $24.28. The 10th percentile was $17.50 an hour and the 90th was $33.63.
Which state pays sterile processing techs the most?
California, with a mean annual wage of $65,100 for medical equipment preparers in BLS's May 2025 data. Washington ($58,170) and Massachusetts ($57,800) came next.
Does getting the CRCST increase your pay?
No official source measures it. Many hospital posts require or prefer certification, and seven states require it by law, so certification widens the jobs you can apply for. Compare local posts that require it with posts that don't.
Which states require sterile processing certification?
HSPA lists seven: Connecticut, Delaware, Minnesota, New Jersey, New York, Pennsylvania and Tennessee. Each law gives new hires a set time to certify, from 18 months to three years.
Is the demand for sterile processing technicians growing?
Yes. BLS projects 10.8% employment growth for medical equipment preparers from 2025 to 2035, against 3.5% for all occupations, with about 10,700 openings a year on average.
How many sterile processing technicians are there in the US?
BLS counted 77,420 people employed as medical equipment preparers in May 2025. That category includes sterile processing techs and some related roles.
We are not affiliated with HSPA and never see real exam questions. Every question is written from HSPA's public content outline and the standards it names, so nothing here is a leaked or recalled item. How we write questions
Questions? support@crcstready.com